|
In the development world, there are a lot many types of indicators in use. Some indicators are in proportions or number, which are most common. But some indicators may be in mean, rates, ratios, or index. They are all numeric and generally wide ranging variable. Most of them are continuous variables which can take up literally any imaginable value within the range of its validity. For example, a proportion indicator can take up any value from 0% to 100% including decimal precision to any extent. A mean can take up literally any value, depending on the indicator content. If it is about mean carbohydrate intake of a certain target group of people, it can take any value from say 50 g to 1500 g, again with theoretically any level of decimal precision. The same can apply for rates, ratios and indices (plural of index). Introducing Binary Indicators Now what is a binary indicator? A binary indicator can take any two values. Not more, not less. “Binary” is a term that became popular with the advent of digital technology, as against analogue of the yesteryears. Analogue could take up any value and any further intermediate value. If you remember how the volume controls of audio systems used to work say 25 years back, you will know what I am talking about. Digital technology understands only two things – 1 and 0. This may be coded as per convenience. Some examples are given below: 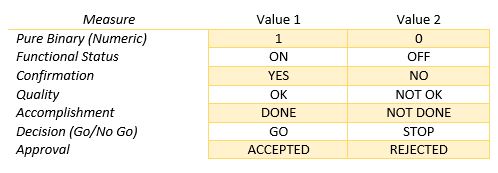 This can be applied to indicators in the development industry. A binary indicator would take only two such values, which will be in essence – Yes or No. Adaptation/Calibration of Binary Indicators Not in all cases will the status of a binary indicator make sense. To make sense, a modification is required. Calibration may sound too big for modifying just two values – Yes and No. But technically it is calibration. You can call it “adaptation” or simply “labelling”. Calibration of a binary indicator means the process of assigning suitable values instead of using “yes” and “no”. I will give a few examples that might make sense for various pairs of values for a binary indicator. 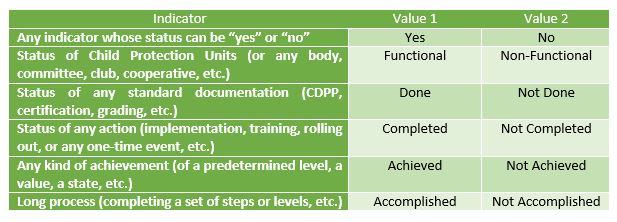 Some people may consider calibrating a binary indicators with the values – Male and Female. I will hold back any agreement or disagreement to that. But binary is usually good for a “positive” and a “negative”. That does not apply to the two genders. Moreover, living in times of LGBT popularity, use of binary indicators for genders may soon run out of use in many contexts. Use of Binary Indicators More than the concept of binary indicator itself, it will be important to understand their use and understand where they can be applied. The theory of the indicator is already over in this article. Now we will see which are the places and contexts where binary indicators can be useful. But even before that, let me tell you where they will not be useful. Scenario 1: When you do a household survey, many things may return a result of either “yes” or “no”. Say for example, we are studying if the households have access to drinking water supply network. But the binary values (yes and no) will apply to one particular household. In each household, the binary indicator will take a different value. So it will be of no use when it comes to any level of reporting. Eventually you will be interested in knowing how many “yes” and how many “no” you got out of the total households that were surveyed. That would in essence become a proportion indicator, telling you what proportion of households said “yes” (or have access). So, this is not the place to use binary indicator. However, if you have many projects across a country where similar work is being done to address access to drinking water networks, you may want to have a dashboard to depict which projects have reached a certain acceptance level (say 80% households having access). There, each project being marked with a “yes” or “no” will help. Scenario 2: You have 20 schools in your program area. And you are working towards ensuring that every school have a functional Parent-Teacher Association. While the program may be reporting how many (number), you may rather look at which program area has accomplished the task of having functional PTAs in “all” schools in its respective program area. A program area marked “yes” means all schools in that area have a functional PTA. While the program area marked “no” would mean that they are yet to have functional PTAs in “all schools in the area. 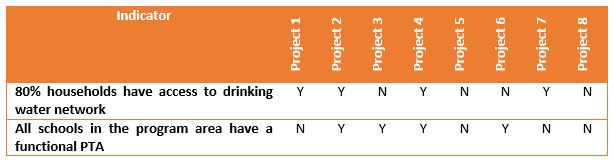 At such higher levels, a binary indicator may be very useful. I’m sure you will find more applications for them.
0 Comments
I would like to present to you a concept called “Parsing of Indicators”. The concept of parsing something is not new. What is new in this document is the application of the process of parsing to indicators. For the benefit of those who have not come across parsing of anything in the past, I will first explain what is parsing, especially in grammar. In grammar, “parsing” is the process of analyzing a word and the role it plays in a given sentence. Let us take a sentence for example – A cat killed the rat. Now if we have to parse the word “killed” in the given sentence, we would say firstly that it is a verb. Further a verb has a tense, voice, mood, person and number – so many things. You don’t believe me? Let me break it down for you. We can use the verb “killed” in the above sentence in so many ways and get different meanings. e.g.:
Tense: Present Perfect Tense Voice: Active Voice Mood: Indicative Mood Person: Third Person Number: Singular Number This is parsing. Even a whole sentence can be parsed. We can parse a sentence and identify the subject, predicate, object, verb, other parts of speech, etc. Even for the nouns and pronouns, we can identify Case, Gender and Number. 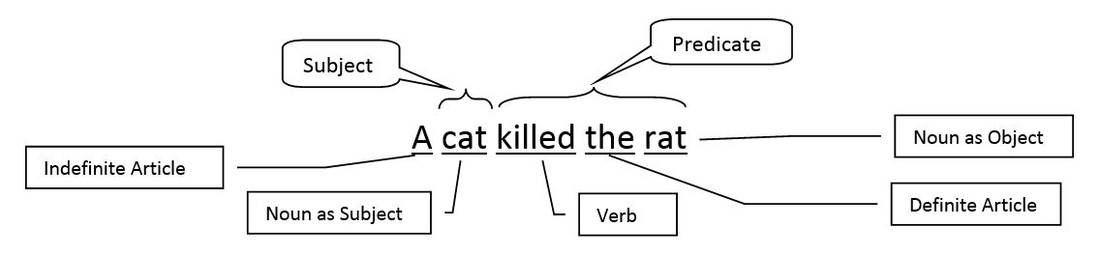 Likewise, parsing an indicator will be an interesting and useful exercise. If an indicator is properly parsed, it can tell us the data needs, analysis plan and give some hints about the measurement and reporting method for an indicator. Many organisations and projects are often faced with challenges in measuring indicators and determining their status. While not knowing appropriate methodology or lacking expertise in data analysis could be popular reasons, not understanding the data needs is more often a bigger challenge. If an indicator is not understood well, neither can the data collection be planned, nor can data be analysed uniformly. Different people might just end up with different results extracted from the same data set. Let us see, how an indicator can be parsed. The first step is to identify the various parts or components of an indicator. Before we try that, let us look at some examples of indicators
These are various different types of indicators – Proportions, Means, Rates, Ratios and Indices. Here we will be more interested in proportions and numbers which are like the M&E lifeblood for most development organisations. For that purpose, let us look at the first three indicators above and a few more.
If we closely observe these indicators, they have something in common, especially in terms of their structure or syntax. 1st Part: The type of measure – Proportion or Number 2nd Part: The word “of” 3rd Part: A particular group of people (or non-personal entity) 4th Part: A verb of doing or being 5th Part: A situation/status/criteria/standard If we can divide each indicator based on these five parts and place them in a table, it will look like below: 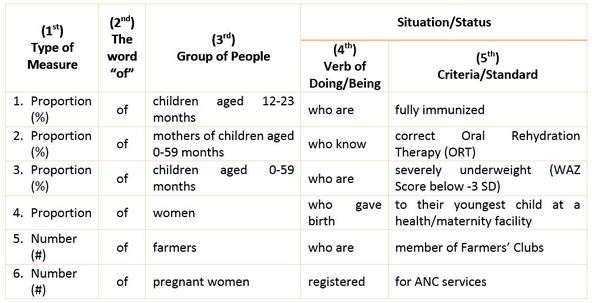 It is one thing to parse an indicator in the above manner and identify its various parts or components. But what we can do with such parsing, is of greater significance. For that, we will see, what each of the above five parts of an indicator mean and what they imply.
The criteria or standard in an indicator describes what would qualify a person to be counted for that indicator. In the case of proportion indicators, describes what would qualify a person in being counted for the numerator. To close with, let us look at the parsing of a few indicators, the grammar way… 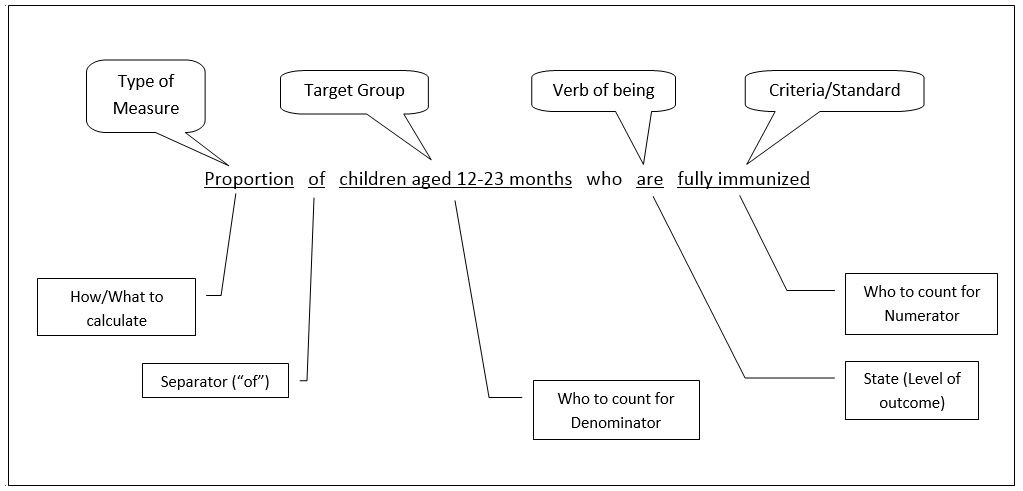 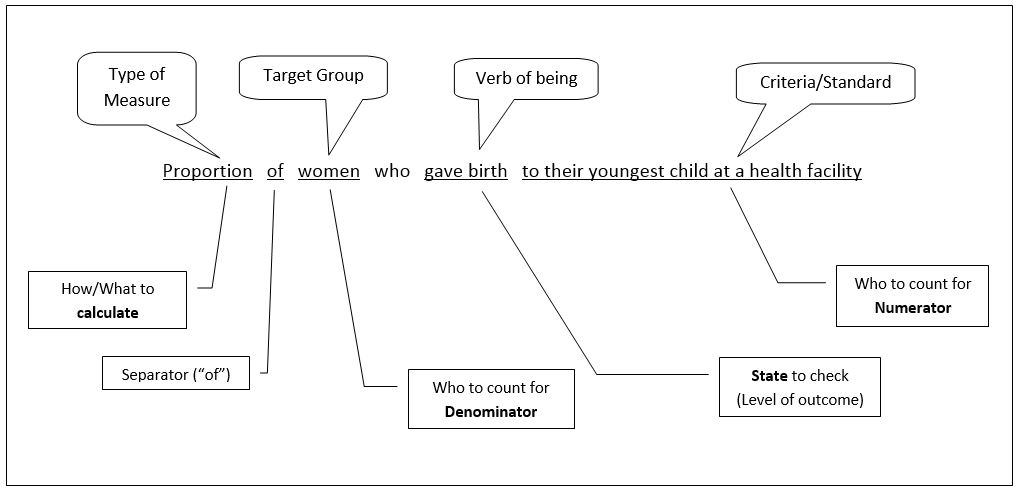 Try doing this with other indicators...
Based on my experience of monitoring and reporting from the filed offices, I have identified and addressed some of the issues pertaining to “evidence based” reporting. I think, some of the things for which the support offices seek evidence are vague terms and phrases that are not substantiated by data and its source. If these are taken care of and explicitly mentioned in the reports, a large part of the “evidence based” issues will be resolved. “Evidence Base” does not always mean that whatever we say has to be backed up by some survey result. We all know that frequent surveys, and for everything, are not possible. But the idea is to mention things that authenticate our narratives.
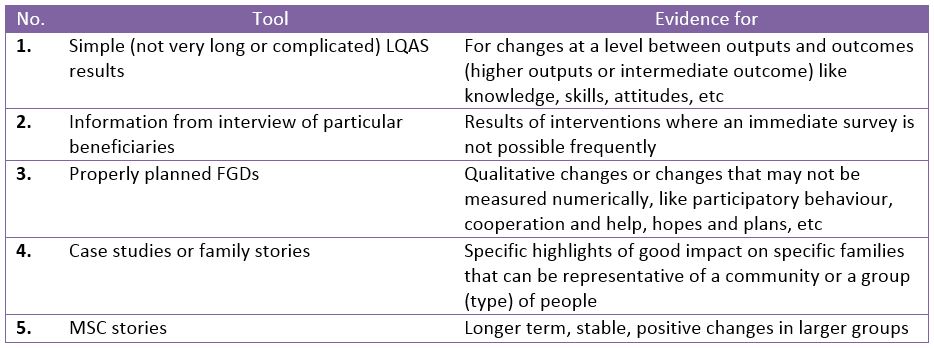 A diagram to remember: 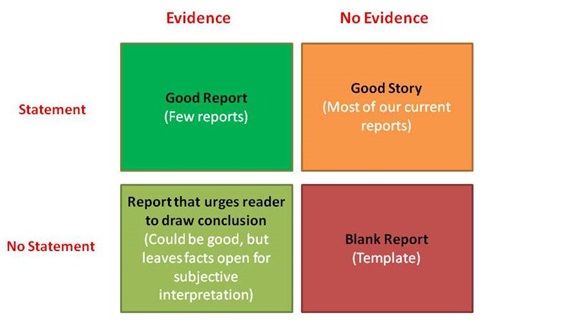 Common phrases that are used in reporting, but hardly means anything of worth:
Bottom-line: If you have a conclusion to make, it is surely based on some observation. Please share that observation, made through a valid process. It becomes evidence. |
AuthorProttoy Kumar Das Archives
December 2016
Categories
|
 RSS Feed
